Introduction
Welcome to the last post for 2025! I encountered a strange issue a couple of months ago and never came around creating a blog for it until now. This post will be a bit lengthy and will have several different issues, that we encountered in one go, that we will fix!
It started with a customer executing a regular Recovery Plan in VMware Cloud Director Availability that had several Recovery Steps. One of these Recovery Steps had several VM’s that had to be started in sequence. This got ‘stuck’, as in took a long time, and the customer grew impatient after a couple of hours and ultimately removed everything related to the ‘stuck’ VM that was still failing over. This is when the issues started and we are going to start the blogpost.
Troubleshooting
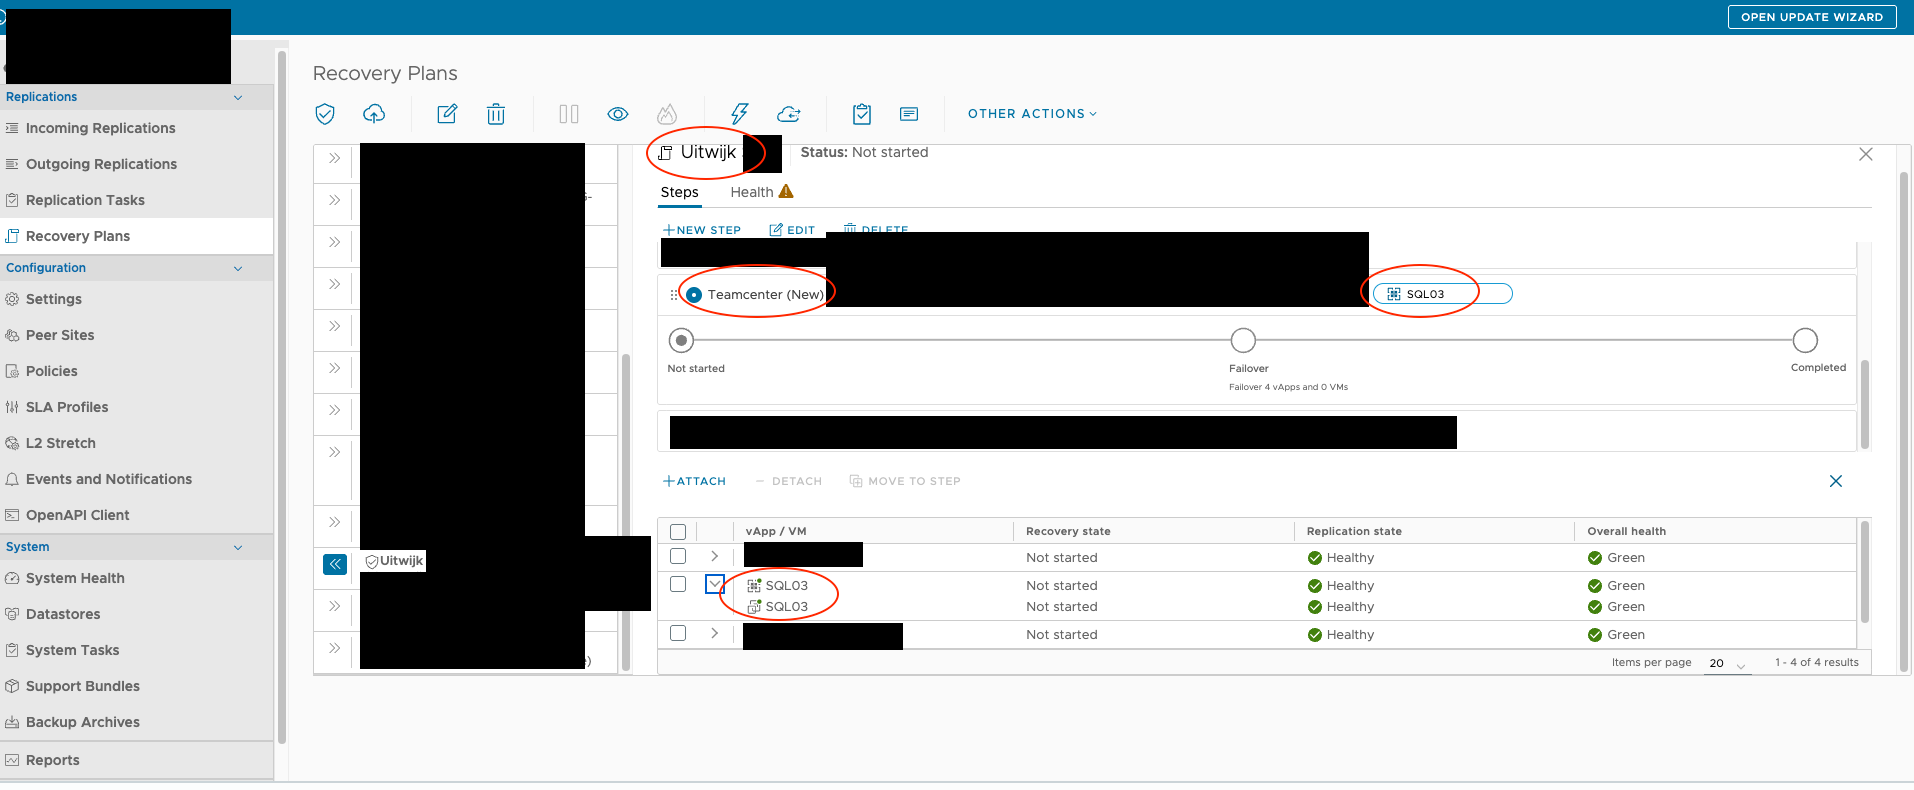
Let’s start of with a general overview from the Recovery Plan from a Healthy perspective. We can see there are several steps included, several VM’s included and several replication states. I’ve highlighted some information that you might recognize later on in the post.
First things first, the customer removed a running replication from the VCDA environment while the Recovery Plan was running on this (not the last) Recovery Step. This did not resolve the issue at hand. I found a rogue replication entry that was still present in the Incoming Replication list. So I removed that. This also did not fix the issue.
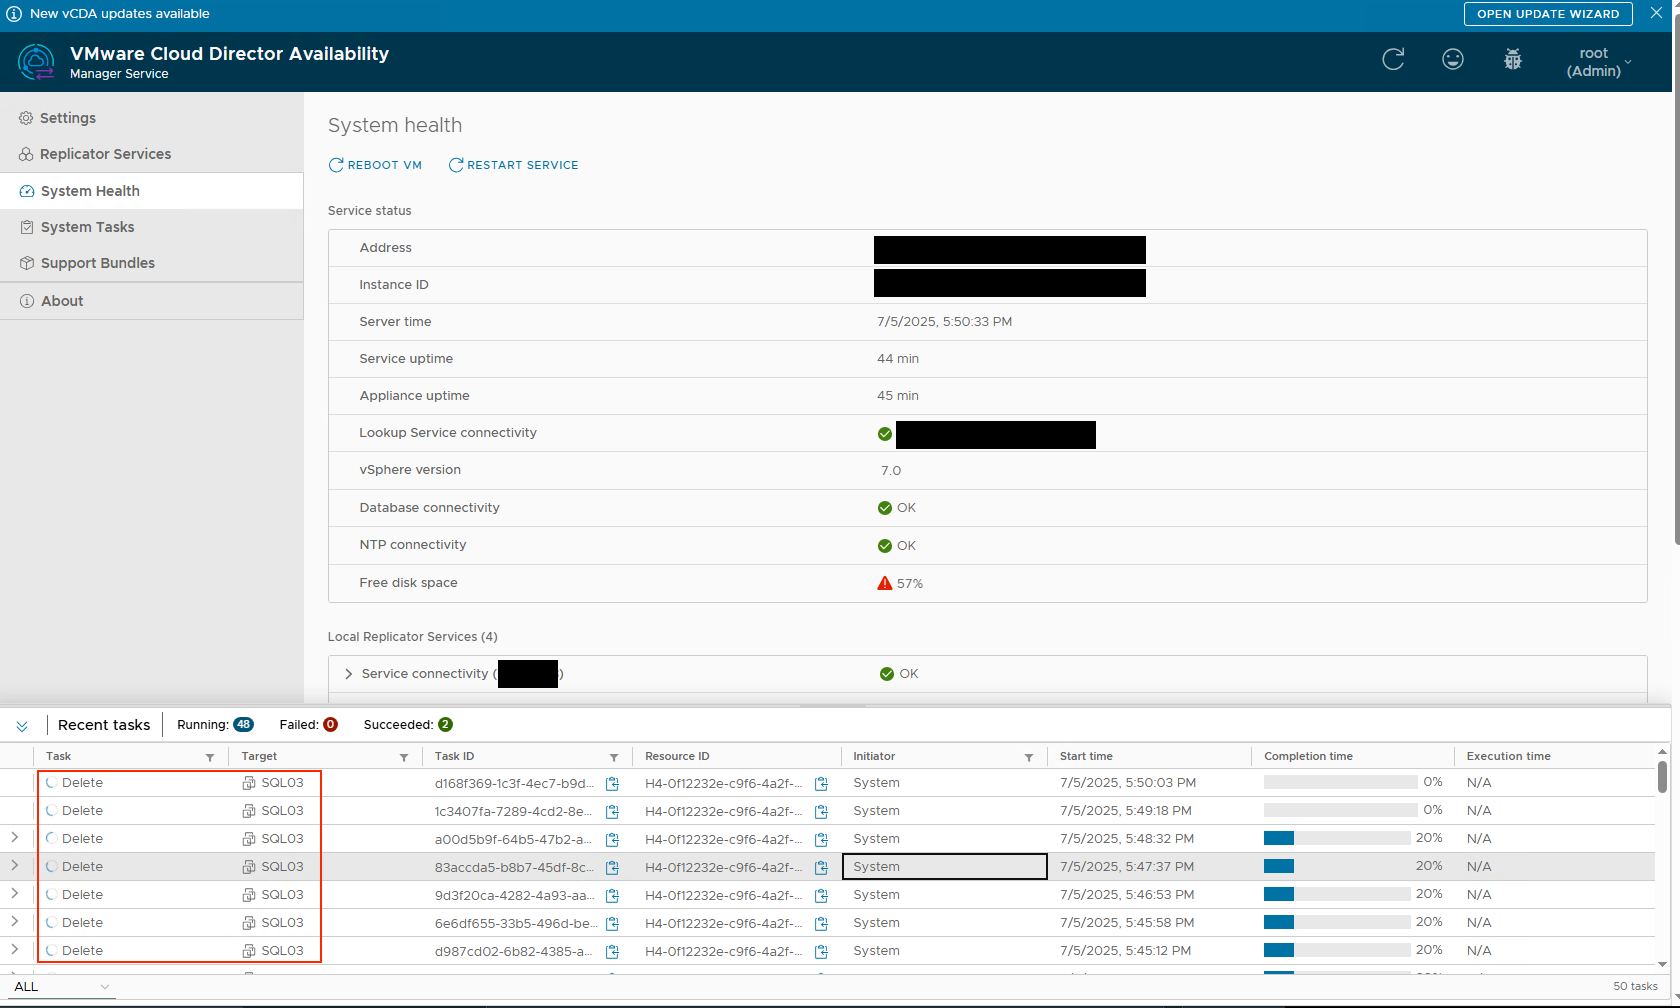
Looking more carefully at the back-end enviroment (the VCDA Manager Service) I noticed that there are still constant deletes being pushed into the back-end, eventhough the replication is not there anymore (since we removed it (twice)). After logging in we noticed the following:
Since we have a couple of replication appliances we had to find the one that was currently deleting the replication and would usually hold the lock on it. This can be done inside the database for the VCDA Manager Appliance on the destination:
psql h4manager -U h4postgres
select * from replication where id ='H4-0f12232e-c9f6-4a2f-9487-f5bf2c4fcdb2';
This query will return a ton of data, look for the field called “destination_replicator_id”. Take a note and run the following query:
select * from replicator where id = "id from the previous step";
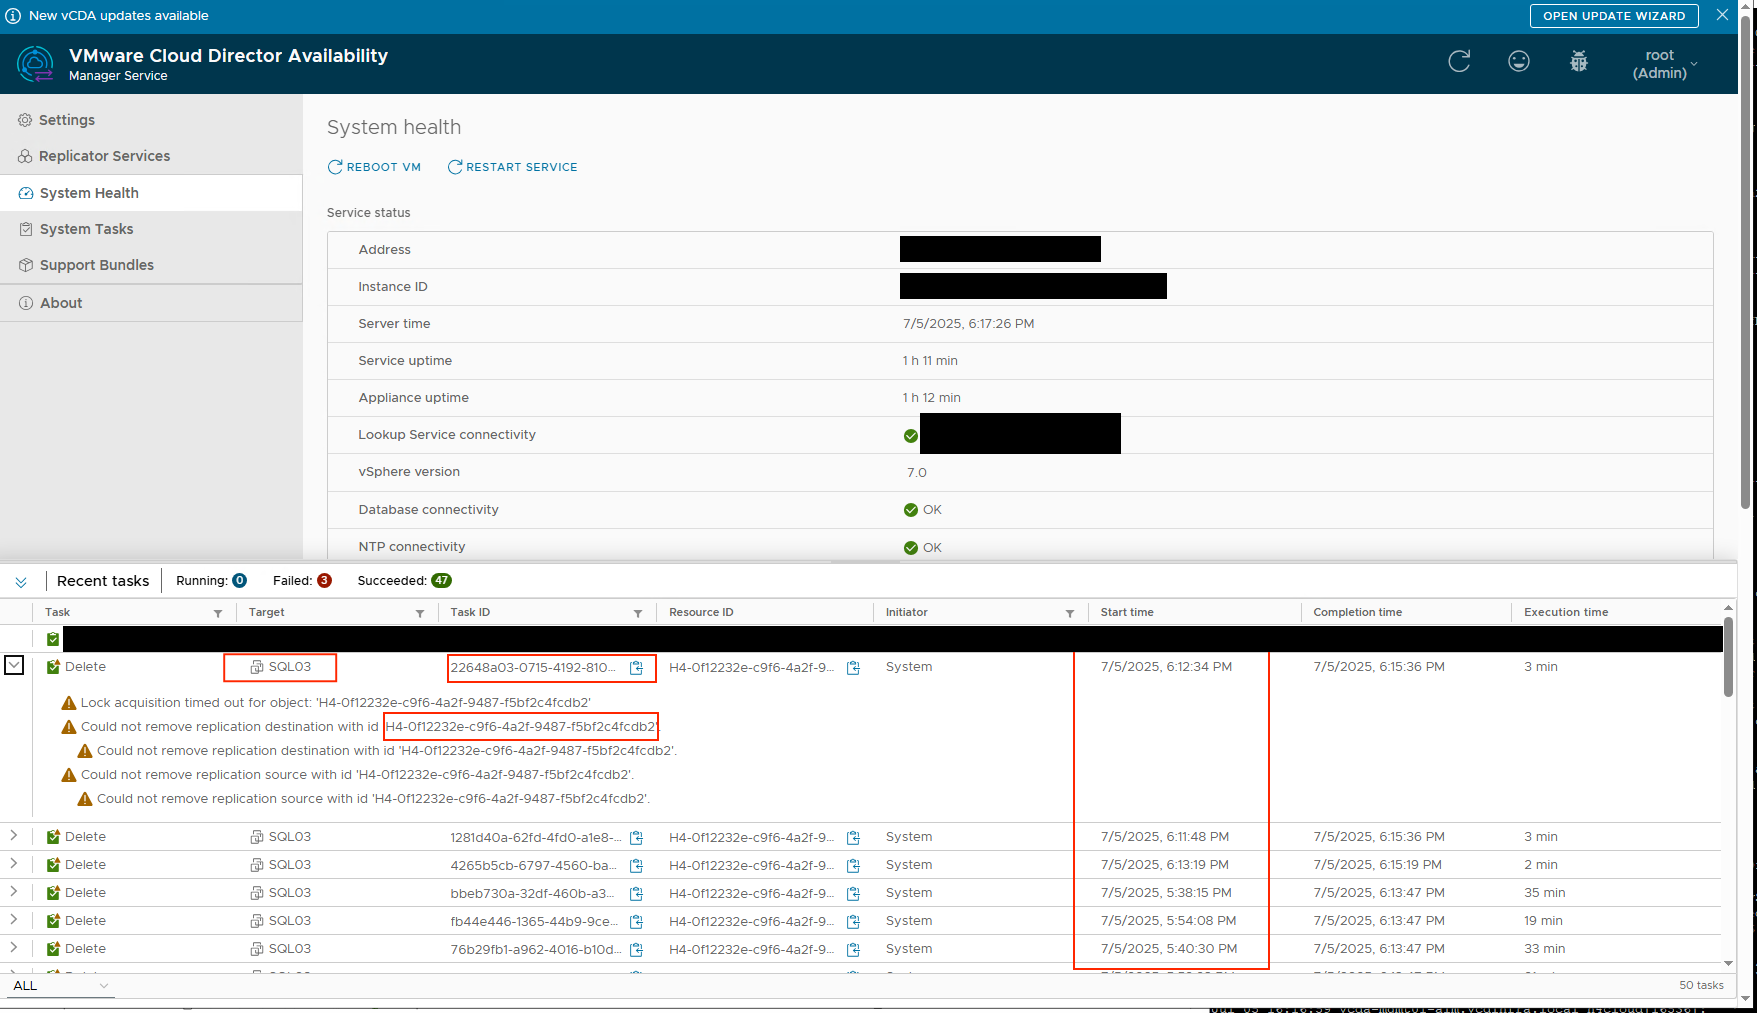
This will also return a ton of data, but it will return the replicator it is using. Take a look at the field “api_url” for the IP address and the field “description” for the description you put in yourself while adding the replicator to the manager. Once we knew this, we logged into that replicator and behold the following:
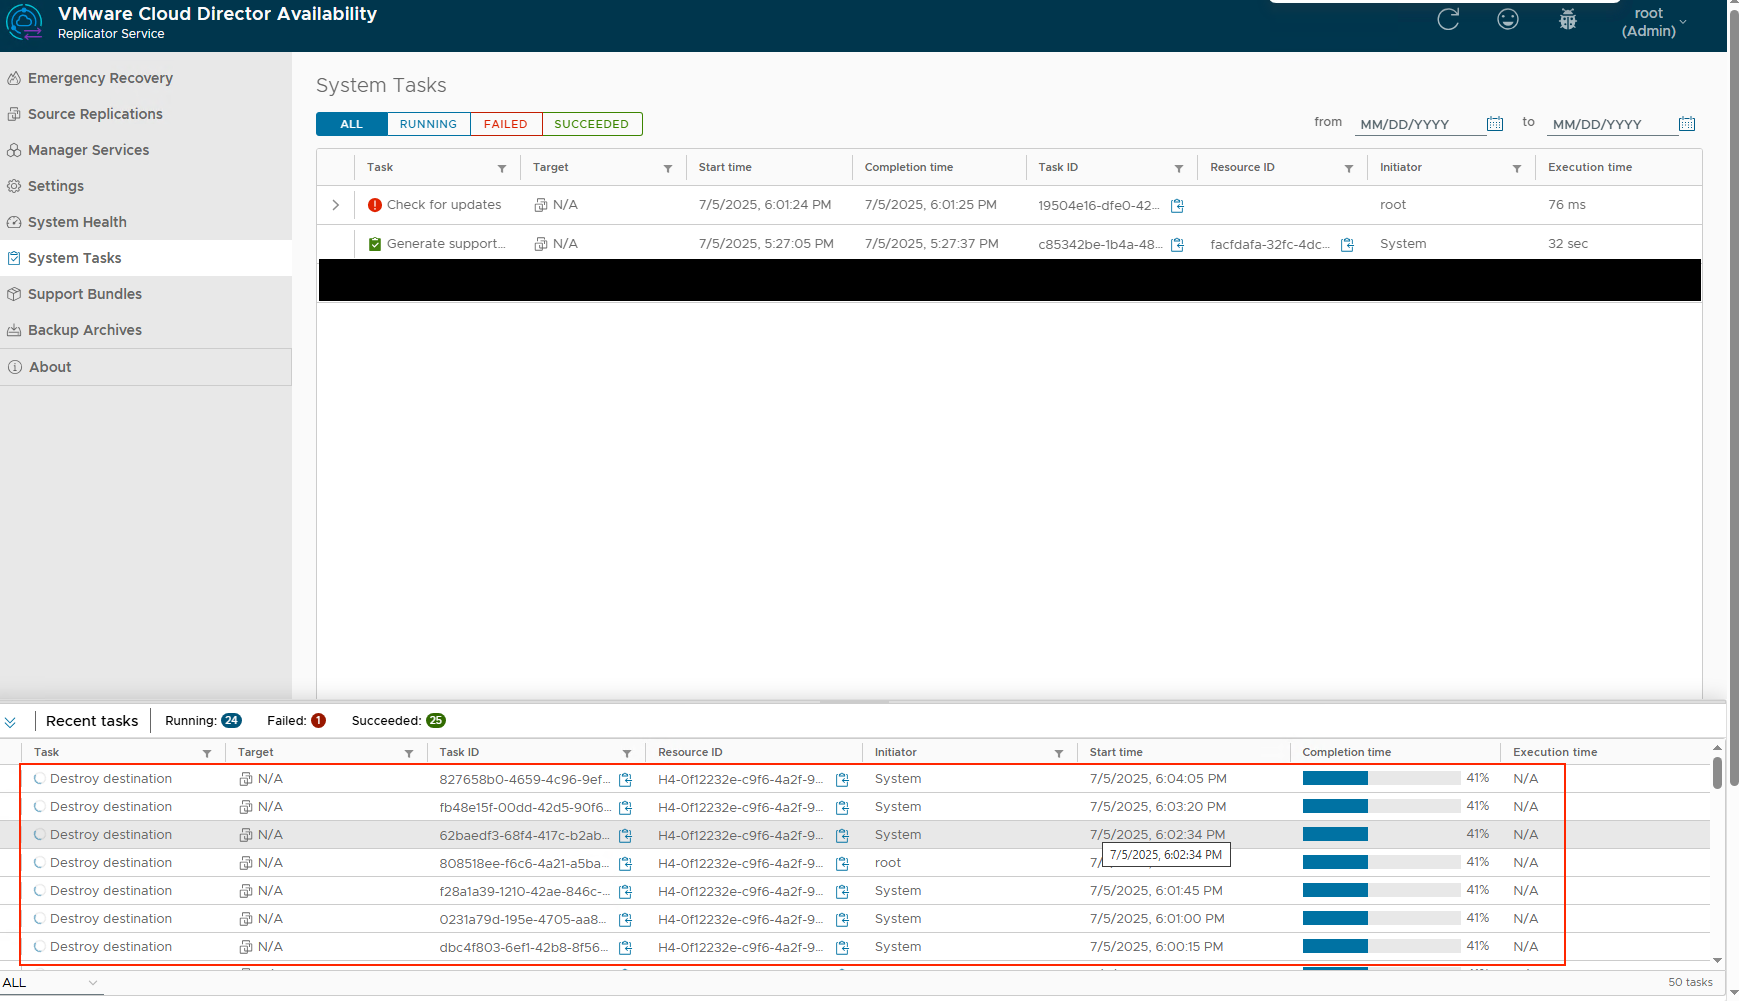
As you can see, the tasks did complete and come through to the Replicator Appliance, however they were still running there and never completed. Not even after a restart for the Replicator and Manager appliance. The same behaviour continued.
Bonus points:
You can also look up the task itself in the database with the task ID's you can find in several of the screenshots:
select * from task where id = 'task id';
These tasks were all still running. The first step I took was to update their state to force a stop on them. You can do this with the following query:
update task set state = 'FAILED' where id = 'task id';
Once that is done, you can redo the previous command to verify it it worked. Alright, so now we have succesfully fixed issue 1. a stuck removed task and replication.
Next up, the still running Recovery Plan. A recovery plan consists (database wise) out of a couple of tables such as:
- recoveryplan
- The Recovery Plan itself.
- recoverystep
- The Recovery Plan configured Recovery Steps.
- rp_execution
- The Recovery Plan Execution state.
- rp_execution_step
- The Recovery Plan Recovery Steps Execution state.
- rp_replication_recovery
- A list of recovery actions executed against the replication itself (VM/vAPP).
Let’s start by checking the Recovery Plan itself in the database. Execute the following command to check the Recovery Plan state:
h4cloud=# select state, display_name from recoveryplan;
    state    |                        display_name
-------------+-------------------------------------------------------------
 NOT_STARTED | Demo
 NOT_STARTED | Bryan-Plan
 RUNNING     | Uitwijk
Alright, we can also see the current state here. We can also see the recovery step state with the following command:
h4cloud=# select * from recoverystep where state ='RUNNING';
                  id                 | delay | is_recovered |       name       | prompt | sequence |  state  | version |           recovery_plan_id
--------------------------------------+-------+--------------+------------------+--------+----------+---------+---------+--------------------------------------
 897115e3-14cc-471e-8d35-XXXXXXX |     0 | f            | Teamcenter (New) |        |        7 | RUNNING |       5 | 7d465da8-6a2c-471c-b5ca-XXXXXXXXX
(1 row)
Diving a little deeper into the steps, we can even see the overall execution, the recovery step execution and ultimately the replication recovery steps with the following commands:
h4cloud=# select * from rp_execution;
                  id                  | error | exec_end |       exec_start        | operation |                plan_description                |  plan_name  |            plan_owner             | plan_type | result | version |               plan_id
--------------------------------------+-------+----------+-------------------------+-----------+------------------------------------------------+-------------+-----------------------------------+-----------+--------+---------+--------------------------------------
 05898406-bc46-44c1-86a1-XXXXXXX |       |          | 2025-07-05 11:05:55.656 | FAILOVER  | Uitwijk opstarten | Uitwijk | ORG@Availability | RECOVERY  |        |       0 | 7d465da8-6a2c-471c-b5ca-XXXXXXXXX
(1 row)

rp_execution_step running recovery plan step
h4cloud=# select * from rp_execution_step;
                  id                  | exec_end | exec_seq |       exec_start        | is_skipped | prompt | prompt_time | result | step_delay |               step_id                |    step_name     | version |             plan_exec_id
--------------------------------------+----------+----------+-------------------------+------------+--------+-------------+--------+------------+--------------------------------------+------------------+---------+--------------------------------------
 a6cf57ee-ccfa-4da9-80fc-XXXXXXXXX |          |        7 | 2025-07-05 11:25:17.837 | f          |        |             |        |          0 | 897115e3-14cc-471e-8d35-XXXXXXXXX | Teamcenter (New) |       0 | 05898406-bc46-44c1-86a1-XXXXXXX
(1 row)

rp_replication_recovery:
                  id                  | error |        exec_end         |       exec_start        |               owner               | recovery_state |             replication_id              |  result   |   source_site    | version |      vm_name      | warnings |     vapp_name     |             vapp_replication_id             |             st
ep_exec_id
--------------------------------------+-------+-------------------------+-------------------------+-----------------------------------+----------------+-----------------------------------------+-----------+------------------+---------+-------------------+----------+-------------------+---------------------------------------------+--------------------------------------
h4cloud=# select * from rp_replication_recovery;
4739b6f7-1eb6-4fa6-810b-XXXXXXX |       |                         | 2025-07-05 11:25:17.913 | ORG@Availability |                | C4-5825c99e-d8d0-4b89-8a8f-XXXXXXXX |           | DRaaS |       0 | SQL03
           |          | SQL03             | C4VAPP-1c5a7559-7c2d-469b-98f4-XXXXXXX | a6cf57ee-ccfa-4da9-80fc-XXXXXXXX
(1 row)
Now that we’ve seen the database structure, we need to start fixing the states to let the Recovery Plan stop it’s running state. This part took a bit of troubleshooting and fiddling around. Up until this point, I had not restarted the VCDA Manager appliance again. To be sure that I could restore a consistent state I stopped the VM made a snapshot and started the VM again. However, behold issue number 3, the VCDA Manager Cloud Service would not start anymore. The following error came up:
2025-07-05 16:25:13.557 ERROR - [44082cc7-1579-4207-b0df-75fd105c1a4c] [main] o.s.boot.SpringApplication               : Application run failed

com.vmware.h4.cloud.api.exceptions.VmReplicationNotFoundException: Replication with id 'C4-5825c99e-d8d0-4b89-8a8f-XXXXXXXXXXXXX' was not found.
        at com.vmware.h4.cloud.repo.CloudRecoveryPlanExecutionRepo.lambda$getReplicationRecoveryState$1(CloudRecoveryPlanExecutionRepo.java:48)
        at java.base/java.util.Optional.orElseThrow(Optional.java:403)
        at com.vmware.h4.cloud.repo.CloudRecoveryPlanExecutionRepo.getReplicationRecoveryState(CloudRecoveryPlanExecutionRepo.java:48)
        at com.vmware.h4.recoveryplan.RecoveryPlanExecutionRepoBase.lambda$failUnfinishedRecoveries$4(RecoveryPlanExecutionRepoBase.java:232)
        at java.base/java.util.ArrayList$SubList$2.forEachRemaining(ArrayList.java:1481)
        at java.base/java.util.stream.ReferencePipeline$Head.forEach(ReferencePipeline.java:762)
        at com.vmware.h4.recoveryplan.RecoveryPlanExecutionRepoBase.lambda$failUnfinishedRecoveries$5(RecoveryPlanExecutionRepoBase.java:231)
        at com.vmware.h4.common.jpa.PagingUtil.lambda$pagedInClause$0(PagingUtil.java:180)
        at com.vmware.h4.common.jpa.PagingUtil.pagedInClause(PagingUtil.java:220)
        at com.vmware.h4.common.jpa.PagingUtil.pagedInClause(PagingUtil.java:180)
        at com.vmware.h4.recoveryplan.RecoveryPlanExecutionRepoBase.failUnfinishedRecoveries(RecoveryPlanExecutionRepoBase.java:230)
        at com.vmware.h4.recoveryplan.RecoveryPlanExecutionRepoBase.completeUnfinishedExecutions(RecoveryPlanExecutionRepoBase.java:208)
So it seems something we did, did not go well with the services and requirements it has to start. This is the reason I would advise against doing these kind of actions on your environment if you don’t know what you are doing. VMware also strongly advises not to fiddle around in the database and wait for GSS. However I am a bit stubborn and wanted to try to do something. We had the snapshot so we could always go back to the ‘broken’ state we had. Being my stubborn self I got you guys covered if you would encounter this issue at some point. We have to fix a couple of tables and fields to get everying up and running again.
To fix this, we have to go by all of the tables and update any and all running or off tasks:
- First we will stop the current running Recovery Plan with the following code:
update recoveryplan set state ='COMPLETE' where id ='recoveryplan-id';
- Next up, we need to stop the current recovery steps with the following code:
update recoverystep set state ='COMPLETE' where id ='recoverystep-id';
- Next up, we need to stop the current recovery plan execution state with the following code:
update rp_execution set result = 'SUCCEEDED' where id='recoveryplanexecution-id';
- Next up, we need to stop the recoverystep execution states with the following code:
update rp_execution_step set result='SUCCEEDED' where id='recoverystepexecution-id';
- And last enter an end time for the replication recovery action itself.
update rp_replication_recovery set exec_end = '2025-07-05 11:27:15.081' where id = 'replicationrecovery-id';
All of the involved tables were updated at this point. However, the VCDA Manager Cloud Service would still not start. The error this time was somewhat the same unfortunately. Because at this point I basically reverse engineered the structure I was confident to go back and I found that the following had to be done additionally:
- Set a exec_end time on the rp_execution and rp_execution_step. Turns out, these entries need this!:
update rp_execution set exec_end = ‘2025-07-05 11:05:55.656’ where id = ‘recoveryplanexecution-id’;
- Set ‘ is_suspend_requested’ to ‘f’. The customer probably requested a suspend on recovery plan (this step is probably not required, but I did it anyway):
update recoveryplan set is_suspend_requested ='f' where id = 'recoveryplan-id';
- Set a exec_end time for the rp_replication_recovery on the specific VM:
update rp_replication_recovery set exec_end = '2025-07-05 11:27:15.081' where id = 'replicationrecovery-id';
With the last command, the rp_execution, rp_execution_step, rp_replication_recovery tables got emptied instantly and the Cloud Service was able to start up again. These tables get filled with temporary data if you execute a Recovery Plan, so once that is all finished the data in the tables get flushed. You can double check this with the following commands:
h4cloud=# select * from rp_replication_recovery;
 id | error | exec_end | exec_start | owner | recovery_state | replication_id | result | source_site | version | vm_name | warnings | vapp_name | vapp_replication_id | step_exec_id
----+-------+----------+------------+-------+----------------+----------------+--------+-------------+---------+---------+----------+-----------+---------------------+--------------
(0 rows)

h4cloud=# select * from rp_execution;
 id | error | exec_end | exec_start | operation | plan_description | plan_name | plan_owner | plan_type | result | version | plan_id
----+-------+----------+------------+-----------+------------------+-----------+------------+-----------+--------+---------+---------
(0 rows)

h4cloud=# select * from rp_execution_step;
 id | exec_end | exec_seq | exec_start | is_skipped | prompt | prompt_time | result | step_delay | step_id | step_name | version | plan_exec_id
----+----------+----------+------------+------------+--------+-------------+--------+------------+---------+-----------+---------+--------------
(0 rows)
Conclusion
Now that was a tough one during the weekend. But I was able to navigate within the database and it’s structure to reverse engineer the inner workings. With this blogpost you should be able to do a bit yourself, or at least understand how the VCDA Manager Appliance database works, and of course how Recovery Plan’s work.
I hope everybody has a great christmas and I wish everybody a happy new year!
0 Comments